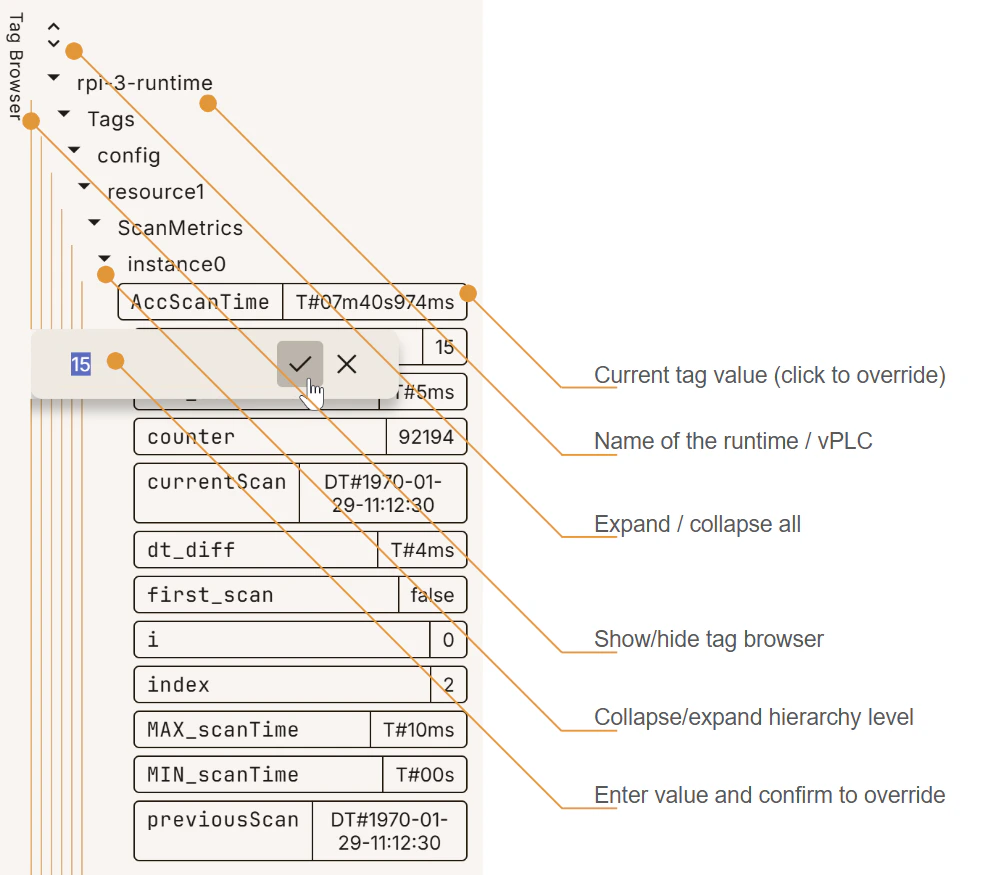
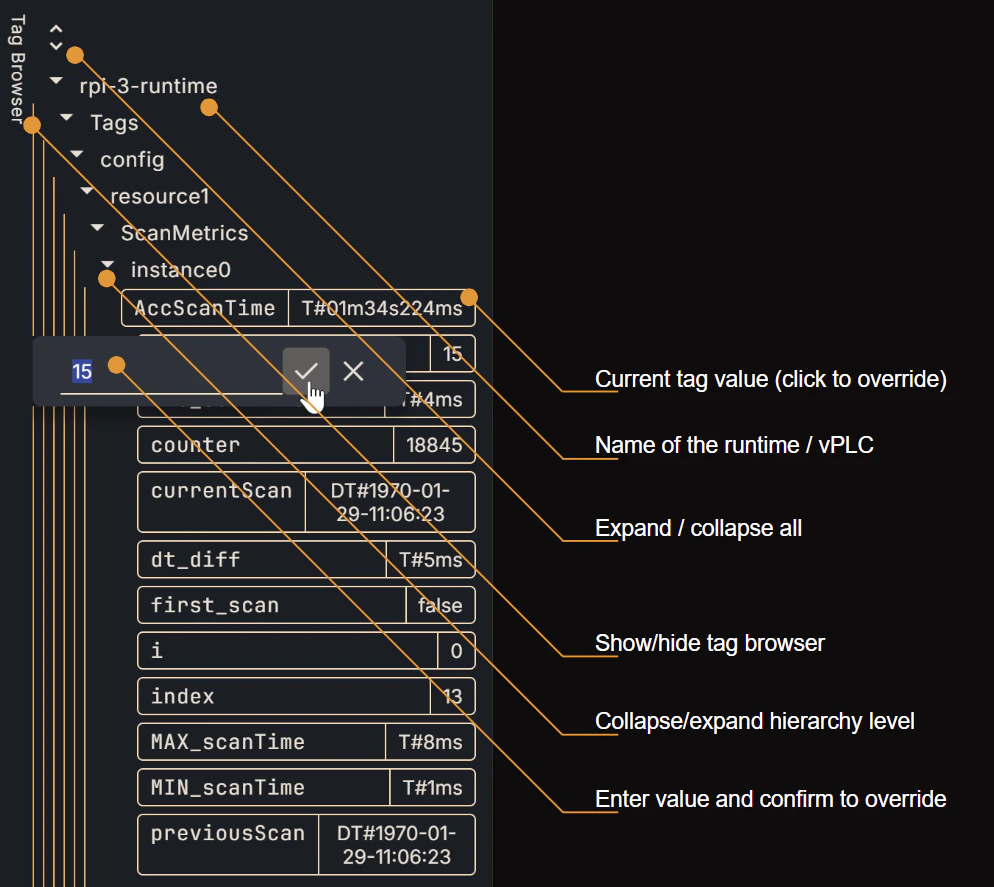
Once your project is applied to a device and executing on it, you will be able to observe the data produced by the runtime through the Tag Browser. On the right-hand edge of your screen, click on “Tag Browser” to expand it. This will give you a window to explore the tags in your project’s namespace, sorted in hierarchical order and broken down into your project’s POUs.Documentation Index
Fetch the complete documentation index at: https://docs.otee.io/llms.txt
Use this file to discover all available pages before exploring further.
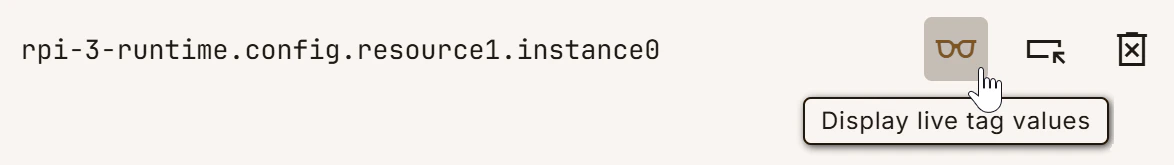
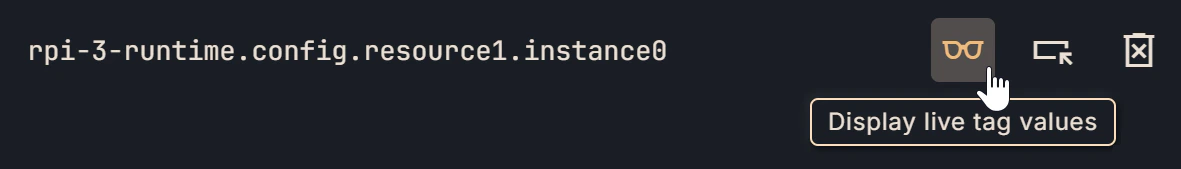
Monitor live tag values in code
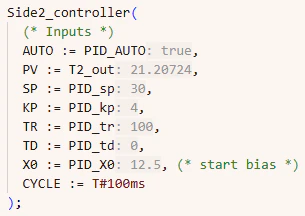
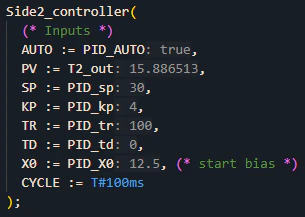
Hit the goggles symbol on top of your tag editor to display live tag values not only in the tag browser (as shown above) but in-line with the code where the variable is used.